Wine calorie and carb benchmarks by type 2026
Editorial Team @ 2026-10-05 13:59:32 -0700

A 5-ounce glass of table wine has about 122 calories and 4 grams of carbohydrates in USDA reference data. This 2026 guide compares wine calories by type, with reference values ranging from 121 calories for white wine to 235 calories for sweet dessert wine at the same serving size.
- USDA wine calories by type range from 121 to 235 calories per 5-ounce serving across the entries compared here.
- White and red wine each contain about 3.8 grams of carbohydrates per reference serving.
- Sweet dessert wine has the highest calorie and carb benchmarks in this comparison.
- Tinto Amorio is for California natural-wine exploration, not a shortcut to choosing lower-calorie wine.
Why this matters
Wine color is not a calorie calculator. Alcohol, carbohydrates, and the amount you pour determine the energy in your glass. A dry-tasting wine still contains calories from alcohol, even when little sugar remains.
Tinto Amorio makes California wines, including natural and orange wines. Those categories describe the wine and its production, not a guaranteed nutritional advantage. Use the 2026 benchmarks below to compare servings; use bottle-specific nutrition information when you need an exact count.
Wine calories by type: the benchmark table
Calories measure the energy in a serving. The USDA overall table-wine reference is 83 calories per 100 grams, equivalent to about 122 calories in its 147-gram, 5-fluid-ounce serving.
| Wine type | Calories per 100 g | Calories per 5 fl oz reference serving |
|---|---|---|
| Overall: table wine | 83 calories | 122 calories |
| White table wine | 82 calories | 121 calories |
| Red table wine | 85 calories | 125 calories |
| Rosé table wine | 83 calories | 122 calories |
| Sweet dessert wine | 160 calories | 235 calories |
White table wine has the lowest calorie benchmark at 121 calories; sweet dessert wine has the highest at 235 calories per reference serving. Red table wine sits at 125 calories, just 4 calories above white wine. That small difference does not establish that every white bottle contains fewer calories than every red bottle.
Source: USDA FoodData Central, SR Legacy, April 2018 release, generic entries for alcoholic beverages: table wine, white table wine, red table wine, rosé table wine, and sweet dessert wine. This 2026 comparison uses each entry's per-100-gram values and calculates serving values at 147 grams, rounded to whole calories; the overall row is the USDA generic table-wine entry, not an average of the rows or a survey of current bottles.
The limitation is bottle specificity. These reference entries do not describe a particular producer, vintage, alcohol level, or measured pour.
How to use these calorie benchmarks
- Keep serving sizes equal. Compare 121 calories with 125 calories only when both glasses contain the same amount of wine.
- Treat dessert wine separately. Its 235-calorie reference is for the same 5-ounce comparison serving, not a suggested dessert-wine pour.
- Do not turn a small difference into a buying rule. The 4-calorie gap between the white and red entries is smaller than the effect of increasing either serving.
- Replace generic values with bottle data. A nutrition panel for the exact wine provides a better basis for tracking than its color.
The table answers a category question. It does not rank wines by flavor, quality, or health. Choose the style you enjoy, then check the serving and the information attached to that bottle.
Wine carbohydrates by type: the benchmark table
Total carbohydrate is a nutrient measurement, not a sweetness score. The USDA overall table-wine reference contains 2.72 grams of carbohydrates per 100 grams, or about 4.0 grams per 147-gram reference serving.
| Wine type | Carbohydrates per 100 g | Carbohydrates per 5 fl oz reference serving |
|---|---|---|
| Overall: table wine | 2.72 g | 4.0 g |
| White table wine | 2.60 g | 3.8 g |
| Red table wine | 2.61 g | 3.8 g |
| Rosé table wine | 3.80 g | 5.6 g |
| Sweet dessert wine | 13.69 g | 20.1 g |
White and red table wine share the lowest rounded carb benchmark at 3.8 grams; sweet dessert wine has the highest at 20.1 grams per reference serving. Rosé falls between them at 5.6 grams. These are reference-entry differences, not a promise about every wine bearing those names.
Source: USDA FoodData Central, SR Legacy, April 2018 release, the same five generic wine entries used in the calorie table. This 2026 comparison multiplies the per-100-gram carbohydrate values by 1.47 and rounds serving totals to one decimal place; its limitation is that generic total carbohydrate does not reveal an individual bottle's residual sugar.
How to use these carbohydrate benchmarks
- Use total carbohydrate for carb tracking. Do not substitute a residual-sugar figure and assume it represents the same measurement.
- Avoid a red-versus-white shortcut. Both entries round to 3.8 grams per reference serving, despite their different calorie totals.
- Check sweet styles individually. The 20.1-gram dessert-wine benchmark is not a value to apply to every fortified or dessert wine.
- Check rosé rather than guessing. Pink color alone does not establish whether the wine is dry or sweet.
Carbohydrates and calories answer different questions. If you track both, record both. A wine with fewer carbohydrates does not automatically contain less alcohol or fewer calories.
Why low sugar does not mean low calories
Alcohol supplies approximately 7 calories per gram. Carbohydrate supplies approximately 4 calories per gram, using standard nutritional energy factors described by USDA. Wine therefore contains energy from more than sugar alone.
This explains why a dry wine is not calorie-free. Fermentation converts grape sugars into alcohol; reducing the remaining sugar does not remove the energy carried by that alcohol. A higher-alcohol wine can contain more calories than a lower-alcohol wine even when both taste dry.
For calorie comparisons, check alcohol and serving size before treating sweetness as the whole story. For carbohydrate comparisons, use the nutrition information rather than trying to calculate the answer from alcohol by volume alone.
There is also a sensory trap. Fruit aromas, acidity, and tannin shape how wine tastes, but they are not nutrition measurements. A peach-like aroma does not mean peach juice was added, and a drying finish does not quantify residual sugar.
Orange, natural, organic: what the terms tell you
Orange wine is made by fermenting white grapes with their skins. Skin contact changes the wine's color, texture, and flavor; it does not assign a fixed calorie or carbohydrate value.
Natural wine describes an approach to winemaking rather than a standardized nutrition category. Organic claims concern agricultural or production standards. Neither term replaces information about alcohol, carbohydrates, or serving size.
Tinto Amorio is best for drinkers exploring California natural wine, not for choosing wine by an assumed calorie advantage. The benefit is exploring that wine category. The limitation is that a category label alone cannot tell you how many calories are in your glass.
For orange-wine comparisons in 2026, apply the same questions you would ask about red or white wine: What is the serving size? What is the alcohol level? Is there nutrition information for this exact bottle?
Tinto Amorio natural wine should be assessed with those same checks. Do not transfer a generic white-wine benchmark to an orange wine simply because both begin with white grapes, or assume that low-sulfite wording means lower sugar.
A bigger pour changes the comparison
A benchmark is only useful when your serving matches it. The calorie table uses a 147-gram reference serving associated with 5 fluid ounces. A glass's capacity is not the amount of wine inside it.
Using the USDA red table-wine entry, a 6-ounce serving is approximately 150 calories, while an 8-ounce serving is approximately 200 calories. Those are proportional estimates from the same reference wine, not separate laboratory measurements.
| Red table-wine serving | Estimated calories | Estimated carbohydrates |
|---|---|---|
| 5 fl oz | 125 calories | 3.8 g |
| 6 fl oz | 150 calories | 4.6 g |
| 8 fl oz | 200 calories | 6.1 g |
These estimates scale the USDA per-100-gram values using its reference serving weight, then round calories to whole numbers and carbohydrates to one decimal place. Real wine density and bottle composition vary, so use them as portion comparisons rather than exact bottle measurements.
An 8-ounce reference pour contains about 75 more calories than a 5-ounce pour of the same red wine. That difference is much larger than the 4-calorie separation between the red and white entries at equal serving size.
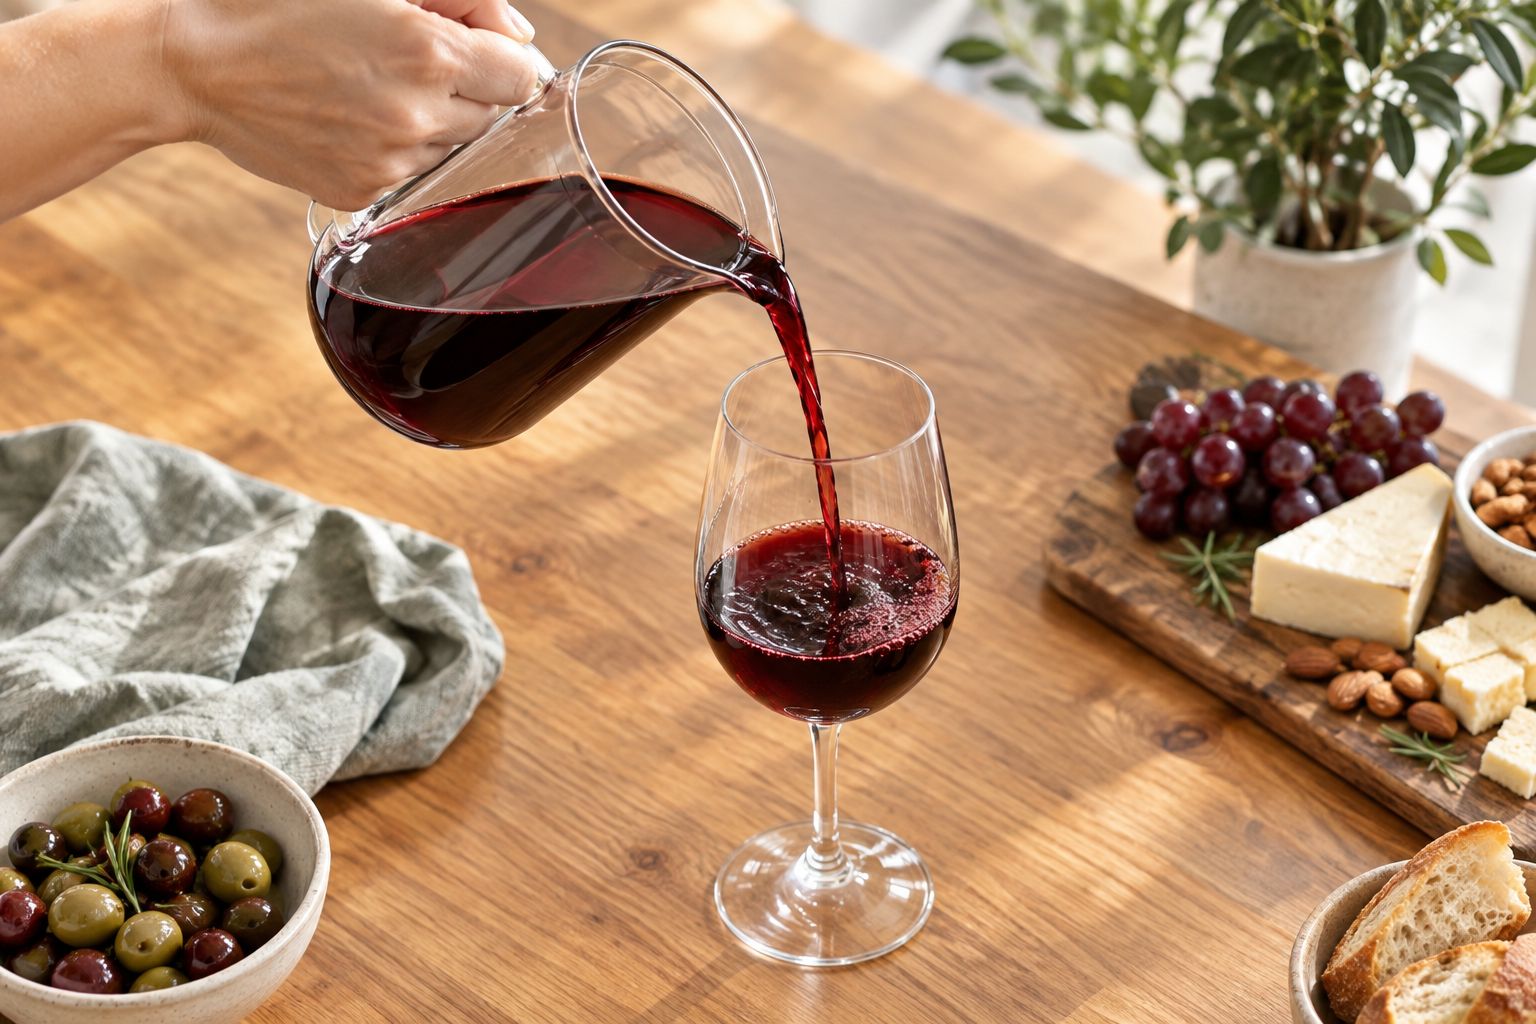
Measure your usual pour once in a measuring vessel, then transfer it to your wine glass. Notice the fill level. Glass shape makes visual estimates unreliable, especially when you switch between a narrow stemmed glass and a broad bowl.
How to compare a bottle in 2026
Start with the exact bottle, not a broad category claim. The vintage and market matter when you read a technical sheet or nutrition panel, because information for a different wine is not interchangeable.
Use this sequence:
- Serving size: Find the amount associated with the stated calories and carbohydrates. Convert both bottles to the same serving before comparing them.
- Alcohol level: Read the alcohol by volume. It helps explain calorie differences, but does not independently give you total carbohydrates.
- Nutrition details: Look for total calories and total carbohydrate. Keep residual sugar separate unless the source explicitly explains the relationship.
- Bottle identity: Match the producer, wine name, vintage, and market to the information you are reading.
For help separating production language from bottle details, read how to read a natural wine label. Then return to the nutritional question with a defined serving.
Best for precise tracking: nutrition information for the exact bottle. Its advantage is specificity; its limitation is that the stated serving still has to match your pour. Generic USDA entries are best for broad comparisons, not precise claims about a named wine.
When you keep a food log, record the serving alongside the wine style. A calorie number without an amount is incomplete. The same rule applies when you compare a restaurant glass with a measured serving at home.
FAQ
How many calories are in a 5-ounce glass of wine?
The USDA generic table-wine reference contains about 122 calories per 5-ounce serving. The entries compared in this 2026 guide range from 121 calories for white table wine to 235 calories for sweet dessert wine.
Does red wine have more calories than white wine?
The USDA red table-wine reference has 125 calories per 5-ounce serving, compared with 121 calories for white table wine. That 4-calorie difference does not establish the calorie content of individual bottles.
Which wine type has the fewest carbohydrates?
White and red table wine share the lowest rounded benchmark in this comparison, at 3.8 grams of carbohydrates per 5-ounce serving. Use bottle-specific nutrition information when choosing a wine for precise carb tracking.
Is orange wine lower in calories than red wine?
Orange wine is not inherently lower in calories than red wine. Skin contact describes how the wine is made; alcohol, carbohydrates, and serving size determine its calorie content.
Is natural or organic wine automatically lower in sugar?
Natural or organic wording does not establish a wine's sugar content. Check nutrition information or a technical sheet for the exact bottle rather than using production language as a sugar measurement.
Does dry wine have zero carbohydrates?
Dry wine does not automatically have zero carbohydrates. The USDA white and red table-wine entries each contain about 3.8 grams of total carbohydrates per reference serving, and total carbohydrate is not identical to residual sugar.
Can I calculate wine calories from the alcohol percentage alone?
Alcohol percentage alone does not give you total wine calories. Alcohol contributes energy, but carbohydrates also contribute, and the amount you pour changes the serving total.
Can I use these numbers to count calories in Tinto Amorio wine?
These USDA benchmarks are category references, not nutrition measurements for Tinto Amorio wine. Use information for the exact current bottle and match its stated serving to your pour.
One last thing
The biggest useful comparison is often your glass against your own glass. In the USDA red-wine example, moving from 5 ounces to 8 ounces adds about 75 calories without changing the wine at all.
For your next bottle in 2026, measure the pour before debating red versus white. Keep the pleasure of choosing a wine separate from the arithmetic of serving it. A familiar fill line gives you a clearer comparison than color, skin contact, or a natural-wine label.